Bioinformatics
NGS data analysis and single-cell spatial phenotyping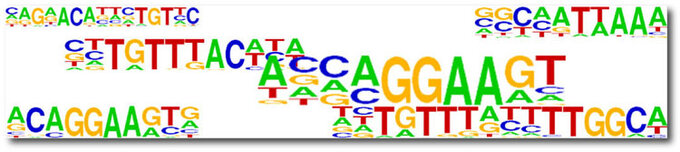
The precise regulation of gene expression is controlled by multiple mechanisms, such as the sequence-specific binding of transcription factors to DNA, epigenetic signals and a chromatin state. The understanding of these processes requires large-scale sequencing experiments to analyze genome-wide data.
Analysis of next-generation sequencing and other high-throughput genomics data is established to assist the lab members with the integration of their genomics data into their research. The focus is to provide analysis support for next-generation sequencing applications like ChIP-seq and RNA-seq. Due to the diversity of research interests in the lab and the changing needs of individual projects we have a variety of tools installed on a local server to help the lab members to process, analyze and visualize this information and interpret genome-wide data. Data analyses are basic analysis including mapping data to reference genomes, standard analysis such as peak finding or gene expression calculation, UCSC visualization, and annotation. The end result is a set of files that can be used to get the projects started in detail.
Common analyses are:
- Miscellaneous sequence manipulation, mapping, converting formats, etc.
- ChIP-Seq: mapping, quality control, peak finding, generation of UCSC files, motif finding, annotation, GO analysis
- ATAC-Seq: mapping, quality control, peak finding, analysis of regulatory elements - promoters, enhancers, insulators
- RNA-Seq: mapping, quality control, gene expression calculation, transcript discovery, annotation, detailed statistical analysis
- scRNA-Seq: filtering, clustering, dimensionality reduction, single cell gene expression calculation, marker discovery, cell type annotation, differential expression
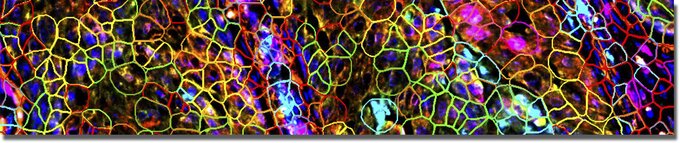
To study complex cellular interactions in cancer and disease progression we use single-cell spatial phenotyping. This method combines multiplex imaging with single-cell resolution to quantify and characterize cell types and states within their native tissue architecture, revealing information about their spatial organization, microenvironments, and interactions.
Analysis workflow for phenotyping includes quality control, cell segmentation, calculation of marker intensities, determination of accurate cell type annotations based on staining profiles, reimporting annotations to QuPath for quantification and visualization.

Dr. Dominica Willmann
Center for Clinical Research
University Freiburg Medical Center
Breisacherstrasse 66
D-79106 Freiburg i. Br.
Germany
+49 (0)761-270 63350
dominica.willmann@uniklinik-freiburg.de